A few examples of
campaigns and its results
Issues vs. Solution
Find below brief explanations about the (former) state of marketing performance from my clients, a resumed explanation of what was deployed and the results achieved, in comparison to the preceding time-frame.

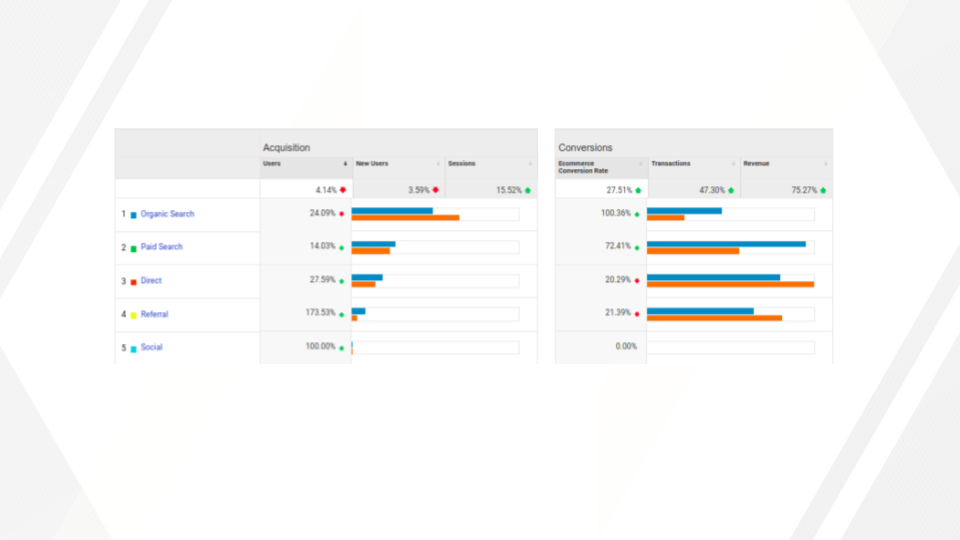
The client had a profitable performance within their SEA, but unable to scale much beyond the results they were achieving over the previous years due to a limited market.
The solution proposed was new Search Ads in combination with a retargeting strategy. For the DACH market.
On a YoY comparison, their costs and acquisition numbers remained at the same level, while their organic and paid acquisition reflected a revenue growth of 75%.
(Data from 2019/20)


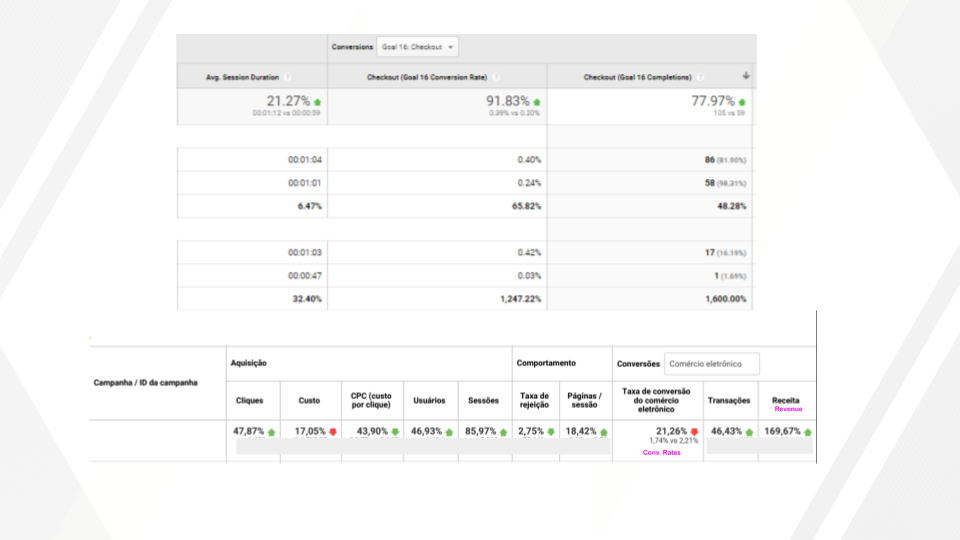
The client had ongoing Search Ads online, but their strategy wasn’t able to generate profitable results.
The proposed solution was to use new Ad copies and new campaigns with different settings, for the Dutch market.
On a YoY comparison, they saw their costs decrease, while their conversion rates and revenue grew by 170%.
(Data from 2018/19)

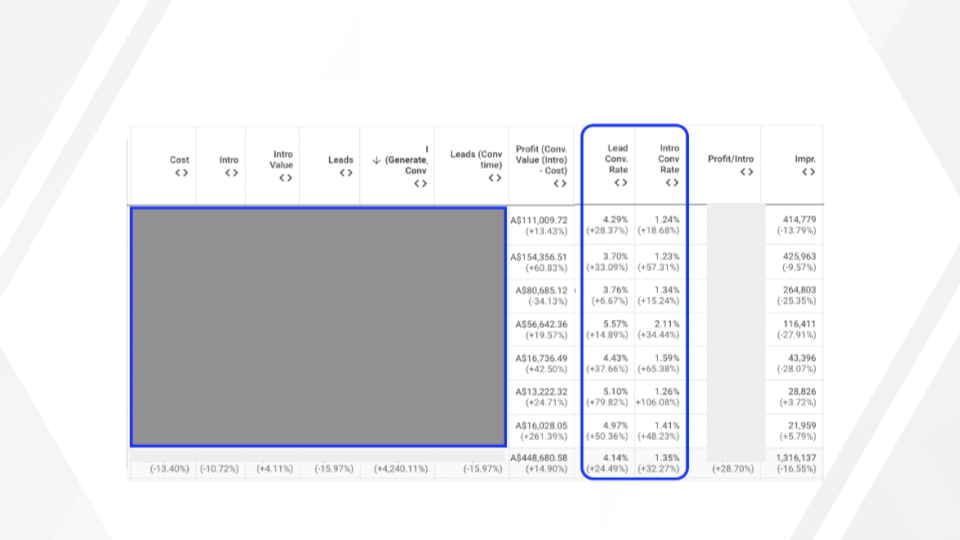
The client had very solid data, a mature pipeline of sales, and a market in decline due to the economic climate within his industry.
The solutions proposed were new ad copies, reviewed campaigns settings and the testing/validation of VBB effectiveness, within different case scenarios. For the AU market.
On a YoY comparison, we scaled his sales funnel for both, MQL and SQL’s.
The image shows profit growth rates and relevant KPIs ranging between 13% to 261% across different campaigns.
(Data from 2022/23)


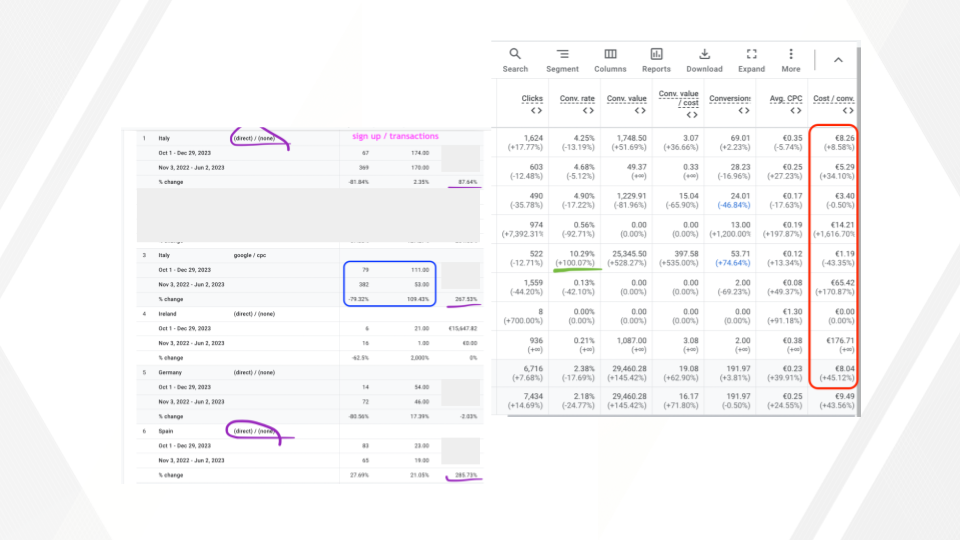
The client was open to try different solutions to improve its conversion rates on a B2B market.
New ad copies were put in place together with new campaigns to A/B test results.
Running specific campaigns to specific countries, top and bottom-funnel strategies were validated and scaled. For the EU market.
The screenshot on the right shows results after the first month, and on the left shows growth in different acquisition channels, where we grew 100% in transaction volume and revenue between 87% to 285% (on a quarterly comparison).
(Data from 2023)
Want to know more about my work method?
Drop me a message – It will take you less than a minute!
